Create a Grid using the Default Constructor#
import minterpy as mp
import numpy as np
import matplotlib.pyplot as plt
Minterpy interpolating polynomials (i.e., in the Lagrange or Newton basis) lives on a grid that holds the so-called unisolvent nodes. An interpolating multi-dimensional polynomial of a given multi-index set of exponents is uniquely determined on the corresponding unisolvent nodes.
An instance of Grid can be constructed via different constructors:
Grid: the default constructor (this page)Grid.from_points(): create an instance with an array of generating points (see the example)Grid.from_function(): create an instance with a generating function (see the example)Grid.from_degree(): create an instance with a complete multi-index set (see the example)Grid.from_value_set(): create an instance based on an array of generating values (see the example)
This guides provides an example on how to construct a Grid instance using the default constructor.
About the default constructor#
The default constructor returns an instance of Grid based on a given multi-index set,
generating function, and generating points. Specifically, it accepts the following
arguments:
multi_index: an instance ofMultiIndexSetthat defines the multi-index set of exponents which in turn defines the polynomials that the grid can support.generating_function: either aCallableor a string that selects a built-in function. This argument is optional; if not specified, the Leja-ordered Chebyshev-Lobatto generating function is selected by default. If aCallableis specified, it must satisfies several conditions as explained in the corresponding example.generating_points: a two-dimensional array of floats that stores the interpolation points per dimension (in each column of the array). This argument is optional; if not specified, the value is set toNoneby default and will be created on the fly from the generating function. If specified, the array must satisfy several conditions as explained in the corresponding example.
The default constructor provides the most general way to create an instance
of Grid. However, when a specific argument is required and known in advance,
it may be better to use one of the other constructors to be more explicit.
Note
When both the generating_function and generating_points are specified,
they must be consistent with respect to the given multi-index set.
In practice, if generating_function is already specified, it is not necessary
to also explicitly specify generating_points as it becomes redundant.
Example: Two-dimensional interpolation grid#
Create an interpolation grid that corresponds to:
a two-dimensional multi-index set \(A = \{ (0, 0), (1, 0), (2, 0), (3, 0), (4, 0), (0, 1), (1, 1), (2, 1), (0, 2), (1, 2), (0, 3) \}\) with respect to \(l_p\)-degree of \(2.0\), and
equidistant generating points.
Multi-index set#
First, create an instance of MultiIndexSet following the above specification:
exponents = np.array([
    [0, 0],
    [1, 0],
    [2, 0],
    [3, 0],
    [4, 0],
    [0, 1],
    [1, 1],
    [2, 1],
    [0, 2],
    [1, 2],
    [0, 3],
])
mi = mp.MultiIndexSet(exponents, lp_degree=2.0)
print(mi)
MultiIndexSet(m=2, n=4, p=2.0)
[[0 0]
 [1 0]
 [2 0]
 [3 0]
 [4 0]
 [0 1]
 [1 1]
 [2 1]
 [0 2]
 [1 2]
 [0 3]]
Generating function#
The generating function for equidistant points can be defined as follows:
def equidistant_gen_function(
    poly_degree: int,
    spatial_dimension: int,
) -> np.ndarray:
    """Create an array of equidistant generating points."""
    xx = np.linspace(-1, 1, poly_degree + 1)[:, np.newaxis]

    return np.tile(xx, spatial_dimension)
Grid instance#
An instance of Grid given a multi-index set and an array of generating points
can be constructed via from_points() method as follows:
grd = mp.Grid(mi, generating_function=equidistant_gen_function)
The grid has the following unisolvent nodes:
print(grd.unisolvent_nodes)
[[-1.  -1. ]
 [-0.5 -1. ]
 [ 0.  -1. ]
 [ 0.5 -1. ]
 [ 1.  -1. ]
 [-1.  -0.5]
 [-0.5 -0.5]
 [ 0.  -0.5]
 [-1.   0. ]
 [-0.5  0. ]
 [-1.   0.5]]
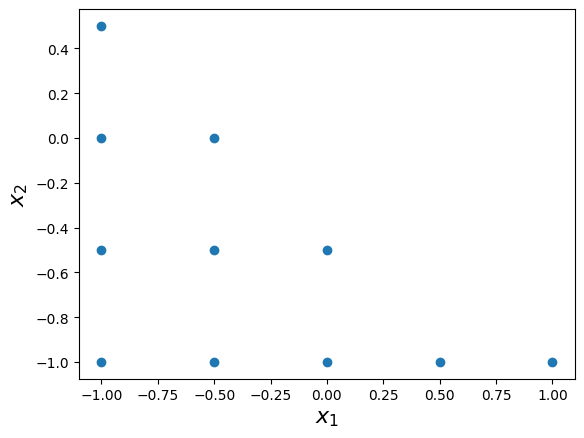
The two-dimensional interpolation grid is plotted below:
plt.scatter(grd.unisolvent_nodes[:, 0], grd.unisolvent_nodes[:, 1])
plt.xlabel("$x_1$", fontsize=16)
plt.ylabel("$x_2$", fontsize=16);
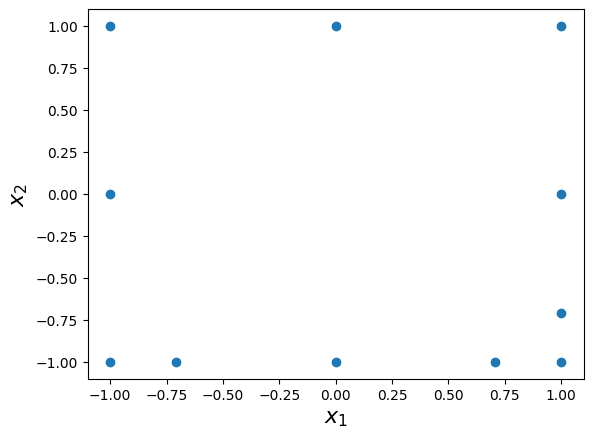
The interpolation grid can be compared with the grid having the same multi-index set but with the Leja-ordered Chebyshev-Lobatto as the generating function (i.e., the default):
grd_def = mp.Grid(mi)
plt.scatter(grd_def.unisolvent_nodes[:, 0], grd_def.unisolvent_nodes[:, 1])
plt.xlabel("$x_1$", fontsize=16)
plt.ylabel("$x_2$", fontsize=16);