Make a Grid Complete#
import minterpy as mp
import numpy as np
import matplotlib.pyplot as plt
A Grid instance is defined by a multi-index set which itself may or may not be complete
(see Make a Multi-Index Set Complete for more details)
A Grid is therefore complete if the underlying multi-index set is complete;
it is incomplete otherwise.
This guide shows how to check if a given Grid instance is complete and make it complete.
Motivating example#
Consider a two-dimensional Leja-ordered Chebyshev-Lobatto interpolation grid whose underlying multi-index set contains the elements:
with respect to \(l_p\)-degree of \(2.0\).
This grid is incomplete; make the grid complete and plot the corresponding unisolvent nodes.
The multi-index set of the Gridcan be created in Minterpy as follows:
mi = mp.MultiIndexSet(np.array([[1, 0], [0, 2]]), lp_degree=2.0)
print(mi)
MultiIndexSet(m=2, n=2, p=2.0)
[[1 0]
 [0 2]]
This set has a polynomial degree of:
mi.poly_degree
2
Note
This polynomial degree corresponds to the minimum degree \(n\) such that all elements in the multi-index set satisfy the \(l_p\)-norm condition \(\lVert \boldsymbol{\alpha} \rVert_p = (\alpha_1^p + \ldots + \alpha_m^p)^{\frac{1}{p}} \leq n\) for all \(\boldsymbol{\alpha} \in A\). Given a set of exponents and \(l_p\)-degree, Minterpy automatically infers this polynomial degree.
An instance of Grid given the multi-index set can then be created as follows:
grd = mp.Grid(mi)
Note that by default, the underlying generating points are the Leja-ordered Chebyshev-Lobatto points.
Check for completeness#
The property is_complete of a Grid instance returns True if the set of exponents in the instance is complete and False otherwise.
grd.is_complete
False
The check indicates that the given grid is not complete with respect to the given polynomial degree and \(l_p\)-degree.
Make complete#
The method make_complete() creates a complete Grid whose underlying multi-index set is complete.
Calling the method returns a new instance of Grid and the result can be stored in a variable for further use:
The method make_complete() creates a complete multi-index set from a given instance of MultiIndexSet.
grd_complete = grd.make_complete()
Notice that the Grid instance is now complete:
grd_complete.is_complete
True
because the underlying multi-index set is now also complete (with respect to \(l_p\)-degree \(2.0\)):
grd_complete.multi_index
MultiIndexSet(
  array([[0, 0],
         [1, 0],
         [2, 0],
         [0, 1],
         [1, 1],
         [0, 2]]),
  lp_degree=2.0
)
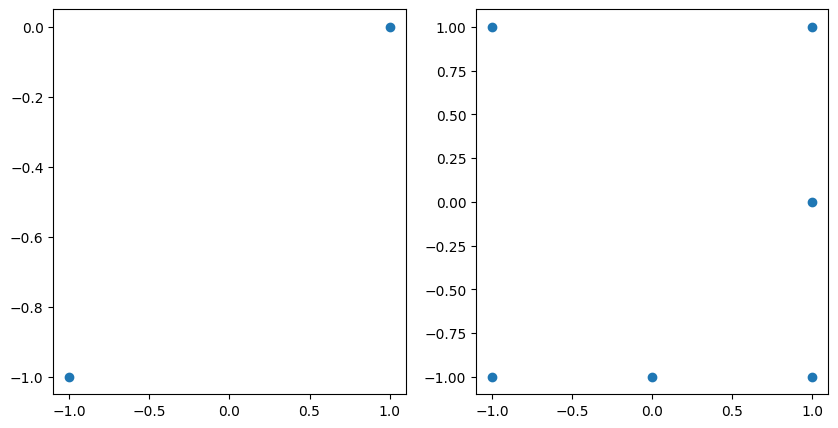
The unisolvent nodes of incomplete and complete grids are shown below:
fig, axs = plt.subplots(1, 2, figsize=(10, 5))
axs[0].scatter(grd.unisolvent_nodes[:, 0], grd.unisolvent_nodes[:, 1])
axs[1].scatter(grd_complete.unisolvent_nodes[:, 0], grd_complete.unisolvent_nodes[:, 1]);